BLOG
The Factory’s Biggest Data Blind Spot: Visibility in Manual Operations
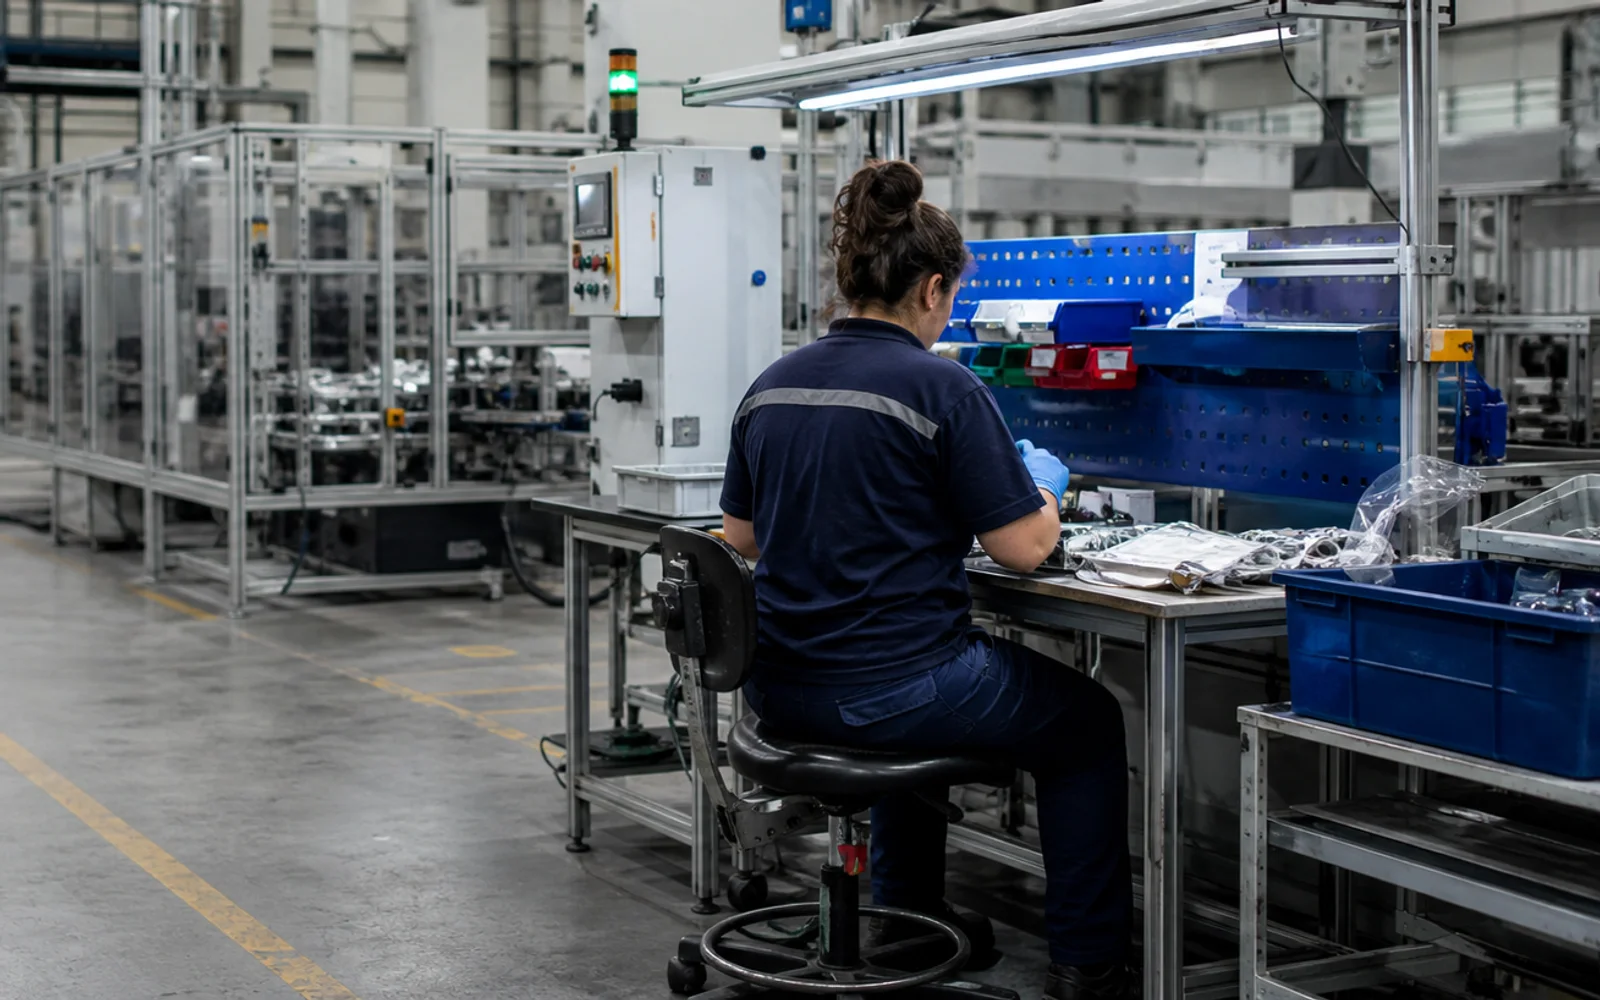
In a modern plant, machines produce data almost continuously. The PLC reports cycle time, SCADA logs downtime, MES shows output and order progress. Look at a manual assembly station on the same line and that visibility drops sharply. A factory’s biggest data blind spot is often not a machine at all, but an operation run by people.
Where Does the Time Between Two Records Go?
You know the standard cycle time of a manual operation, and you know how many parts came off the line at the end of the shift. What happens between those two records is unclear in most plants. The questions that usually go unanswered:
- When did the operation actually start and finish?
- How much time was lost waiting for material?
- Why did the operator leave the station, and how often?
- Which process step drives the variation in cycle time?
- How much of the shift goes to rework and quality checks?
As long as those questions stay unanswered, improvement on manual lines rests on opinion rather than measurement. We discussed the same problem at plant level in our article on the measurable factory: the first requirement of digitalisation is not the number of sensors, but a set of questions that can be answered with numbers.
Why Classic Methods Fall Short in Manual Operations
Time studies, work sampling, barcode scans and MES terminal entries all provide valuable information about manual work. None of them is wrong; their limits only become visible when you compare them with machine-side data.
| Method | What it gives | Its limit |
|---|---|---|
| Time study | Detailed timing per process step | A snapshot sample, and observation changes behaviour |
| Work sampling | Statistical distribution of activities | Not event based, does not explain a single loss |
| Barcode and work order records | Start and finish timestamps | The time in between stays a black box |
| MES operator terminal | Downtime reason, scrap and rework records | Accuracy and continuity depend on manual entry |
| Computer vision | A continuous, timestamped event stream | Requires viewing angle, framing and privacy design |
We explained how these layers feed each other in our article on MES systems and OEE. In that architecture the weakest node is almost always the manual station: every second of the machine is recorded, while a human-run operation is reduced to a single piece count at the end of the shift.
Treating the Camera as a Sensor, Not a Recorder
Computer vision offers a new way to close this visibility gap. The critical shift is one of perspective: a camera is not a device that records images, it is a sensor that produces production data.
People and objects in the frame are detected, related to defined production zones, and their movements are turned into timestamped events. Instead of watching hours of video, you can analyse time spent at the station, entries and exits per zone, visits to the material area and waiting patterns as data. The technology that makes such scenes measurable, where fixed rules cannot describe them, is deep learning based machine vision.
Two Different Layers of Visibility
Layer one: where, when and for how long?
The first layer answers “where, when and for how long”. If the viewing angle and image quality allow it, existing IP cameras can be used to analyse time at station, zone movements and how often the operator leaves. In most plants this layer needs no major hardware investment and delivers first results within weeks. We covered how depth data stabilises person detection in our article on 3D human detection systems; the same principle carries into area analytics with MIS-INSPECT People 3D.
Layer two: what was done, and in the right order?
The second layer goes down to hand and part interaction: was the correct part picked, did the assembly steps follow the right sequence, was a step skipped? It requires closer framing, controlled lighting and application-specific model training. In return it catches an assembly error before the part leaves the line. While MIS-INSPECT inspects the defect on the product, verifying that the process ran in the right order is the job of this second layer.
Being at the Station Is Not the Same as Being Productive
The most common measurement mistake is to count time at the station as productivity. While present at the assembly area, a worker may be waiting for material, waiting for a machine to finish, investigating a quality issue or reworking a part. That is why the output of the data should not be “the operator was at the station for x minutes” but “x minutes were spent on this type of event”. A measurement that does not separate loss types repeats the same error as reducing OEE to a single percentage.
The First Gain Is Not More Output, It Is Better Diagnosis
The first result of computer vision is not a direct productivity increase but detailed operational visibility. Waiting, repeated exits from the station, cycle variation and process deviations become visible. The correct value chain runs in this order:
- Visibility: a timestamped record of what actually happens at the station
- Loss classification: waiting, searching, rework, setup
- Root cause: feeding layout, fixture, work instruction, line balance
- Process change: layout, material flow or station design
- KPI effect: measurable impact on cycle time, line efficiency and OEE
When this order is skipped and a KPI target is set straight away, the project gets stuck on the perception of “they are watching us” and data quality suffers. Turning the collected event stream into models, monitoring them and updating them in the field is a discipline of its own; we manage that in the process intelligence layer with MIS-AGENT.
Measure the Process, Not the Person
Camera analytics in areas where people work must be designed carefully with data protection in mind. Not using facial recognition reduces the risk, but on its own it does not place the system outside personal data legislation. A setup that works in the field rests on these principles:
- The unit of measurement is the station and the process event, not the individual.
- No identity matching and no facial recognition.
- Event data is stored instead of raw footage, with a limited retention period.
- Scope, purpose and retention are explained to employees and their representatives in advance.
- The output is used as a station improvement report, not an individual performance scorecard.
This framework is already being built on lines where people and machines share the same space. As we described in our article on human-machine collaboration in Industry 5.0, the technology is positioned not to replace people but to make their work visible and safe.
How to Set Up a Visibility Pilot for Manual Operations
Instead of a rollout covering the whole plant at once, a pilot that starts with a single station delivers results far faster. The sequence we apply:
- Pick one bottleneck station. The station with the highest cycle time variation usually teaches the most.
- Write down the question to be measured. One sentence with a numeric answer, such as “what share of the shift is waiting time?”
- Define the zones. Assembly area, material area, quality table, off-line. Events only carry meaning through these zones.
- Start with the cameras you already have. If the viewing angle is sufficient, layer one needs no new hardware.
- Collect two weeks of data, then read it together with the shop floor. Interpreting data with the team is the most critical step for adoption.
- Make one process change and measure the same metric again. Visibility only proves its value with a post-intervention measurement.
This is also the stage where you decide which data is processed at the edge and which is carried to the centre. We detailed that design decision in our article on industrial IoT data management: sending every frame to the centre is both costly and unnecessary, generating events on site and transporting only the events is the right architecture for most applications.
From Video to Production Data
At MIS Otomasyon we use the MIS-INSPECT People approach to turn visual activity on the shop floor into measurable operational data. We described the retail and building counterpart of the same technology in our article on MIS-INSPECT People Counter; in manufacturing, the goal is not to watch people more closely but to make visible the processes that sit outside the machines.
To discuss which layer fits your line, explore our solution families or request a demo for a feasibility check with your existing camera infrastructure.
Because a factory’s biggest data blind spot may not always be a machine.